Open Enrollment 2018: Americans Face Year 5 of Higher Premiums & Shrinking Choices
WASHINGTON, D.C., Nov. 1 – The Affordable Care Act has failed to live up to its promises since day one. As this year’s open enrollment for Obamacare begins, Senate Health, Education, Labor, and Pensions Committee Chairman Lamar Alexander (R-Tenn.) and Senate Finance Committee Chairman Orrin Hatch (R-Utah) today released the following analysis on the status of Obamacare for Americans – another year of higher costs, fewer health insurance options, and increased taxpayer burden.[1] Alexander and Hatch are chairmen of the committees with jurisdiction over health care in the U.S. Senate.
Fact: Premium increases this year follow premium spikes of 105%, on average, from 2013-2017, the last 4 years of the Obama administration’s implementation of Obamacare.
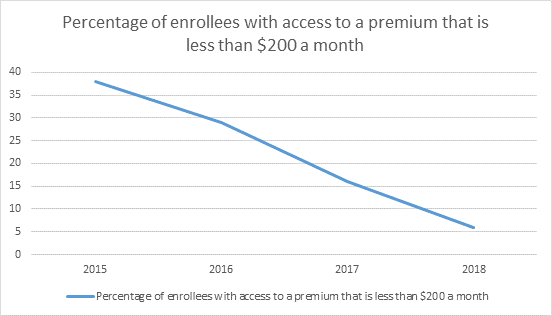
The percentage of exchange enrollees who have the option of buying a plan that costs them $200 or less per month has steadily decreased:[2]

Average premiums for Americans spiked by 105% from 2013 to 2017, while President Obama was in office.[3]
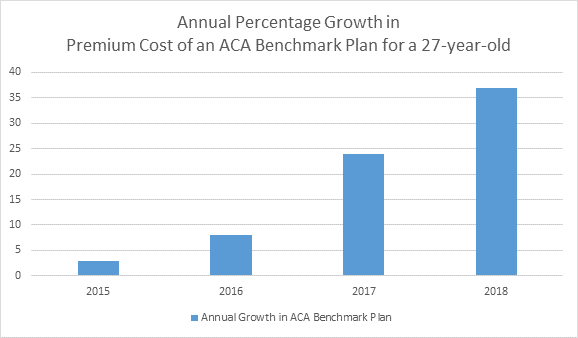
For 2018, the average benchmark premiums – or the premium for the second lowest cost silver plan – will spike by 37%, going from $300 to $411 per month.[4]
Premiums have jumped at unsustainable rates since implementation of Obamacare exchanges – [5]

Fact: Americans in the individual health insurance market have been losing choices since the exchanges opened – the steepest loss was between 2016 and 2017, when consumers lost an average of 16 choices of plans.
There was a large spike in states with just one insurance company offering plans on the exchange in President Obama’s last year in office:
- 2016 – Wyoming had just one issuer on the exchange. [6]
- 2017 – FIVE states had just one issuer for President Obama’s last year in office: Alaska, Alabama, Oklahoma, South Carolina and Wyoming.[7]
- 2018 – EIGHT states have just one issuer on the exchange: Alaska, Delaware, Iowa, Mississippi, Nebraska, Oklahoma, South Carolina, and Wyoming.[8]
Average number of insurance companies competing on the exchanges in each state has continued to drop:
- Six in 2016
- Four in 2017
- Three in 2018[9]
Average plan choice for consumers has been cut by more than half since the exchanges opened – from 54 choices in 2014 to 26 in 2018 – with the largest drop happening in Obama’s last years in office, from 2016 to 2017, when consumers lost an average of 16 choices.[10]
Fact: Rural America has suffered under Obamacare
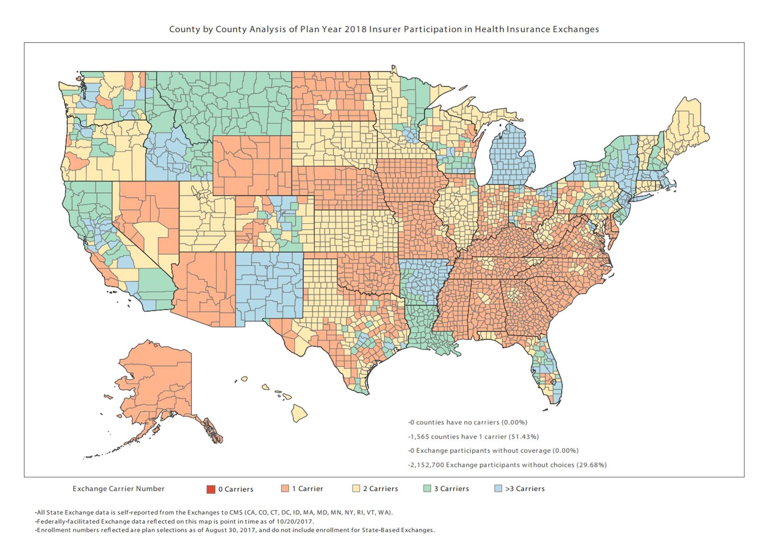
- Over half of counties – mostly in rural areas – will have just one option of an issuer next year.[11] This means Americans in those counties likely have no options for doctor networks – they’re stuck with the one remaining Obamacare insurer network available to them.

- The death spiral for rural America continues:
- 2016 – 2% of consumers had just one insurer to choose from
- 2017 – 20% of consumers had just one insurer to choose from
- 2018 – 29% of consumers will have just one insurer to choose from[13]
Fact: Taxpayers have been stuck paying for higher subsidies as insurers leave the exchanges and remaining insurers hike premiums.
The average premium subsidy has gone up 114% since the exchanges opened – going from $259 per consumer with a tax credit in 2014 to a predicted $555 for 2018. Compared to last year, average Obamacare subsidies are predicted to rise by 45%. [14]
Higher prices lead to higher premium subsidies paid by the taxpayer since consumers eligible for premium tax credits contribute a capped percentage of their income toward monthly premiums. Consumers not eligible for subsidies are stuck paying higher prices for coverage they may not want and cannot afford. In the latest analysis of health care coverage, CBO projected that just as many individuals would purchase health insurance in the individual market without receiving a subsidy (8 million) as those who do benefit from federal financial assistance (8 million)[15]. Obamacare is costing taxpayers and consumers more, rather than less, as was promised.
[1] References in this document to exchange coverage, premiums, and issuers refer to the 36 to 39 states supported by the healthcare.gov platform between 2014 and 2018.
2 https://aspe.hhs.gov/system/files/pdf/258456/Landscape_Master2018_1.pdf page 13
3 https://aspe.hhs.gov/system/files/pdf/256751/IndividualMarketPremiumChanges.pdf page 2
4 https://aspe.hhs.gov/system/files/pdf/258456/Landscape_Master2018_1.pdf Page 6
5 https://aspe.hhs.gov/system/files/pdf/258456/Landscape_Master2018_1.pdf page 7
6 https://aspe.hhs.gov/system/files/pdf/258456/Landscape_Master2018_1.pdf page 19
7 https://aspe.hhs.gov/system/files/pdf/258456/Landscape_Master2018_1.pdf page 19
8 https://aspe.hhs.gov/system/files/pdf/258456/Landscape_Master2018_1.pdf page 19
9 https://aspe.hhs.gov/system/files/pdf/258456/Landscape_Master2018_1.pdf page 3
10 https://aspe.hhs.gov/system/files/pdf/258456/Landscape_Master2018_1.pdf page 5
13 https://aspe.hhs.gov/system/files/pdf/258456/Landscape_Master2018_1.pdf page 5
14https://aspe.hhs.gov/system/files/pdf/258456/Landscape_Master2018_1.pdf page 1
15 https://www.cbo.gov/system/files/115th-congress-2017-2018/reports/53091-fshic.pdf
###
[1] References in this document to exchange coverage, premiums, and issuers refer to the 36 to 39 states supported by the healthcare.gov platform between 2014 and 2018.
[11] https://www.cms.gov/CCIIO/Programs-and-Initiatives/Health-Insurance-Marketplaces/Downloads/2017-10-20-Issuer-County-Map.pdf
Contact: Taylor Haulsee (HELP), (202) 224-8816
Katie Niederee (Finance), (202) 224-4515